Circular Economy

A circular economy-based project at Ikano Bank from my UX internship

Overview

As a recent graduate in interaction design, I had the opportunity to work as an intern UX Designer at Ikano Bank for six months. During this time, I was part of a project focused on circular economy, working alongside the Innovation Lab team at Ikano, as well as a mentor and a master's student. Our approach included user research, prototyping, design sprints, and ideation.

Please note that due to confidentiality agreements, I am unable to provide all the details of the project. However, I will share my contributions and the key findings from our research. I also assisted in creating a digital prototype using Adobe XD, which was used for usability testing.

The objective

The project's objective was to create a product or a service that either supports circular economy or product as a service to the partners of Ikano Bank.

Duration

6 months

Role

  • Intern UX Designer/Researcher

Responsibility

  • Conducted user interviews and analyzed data to identify key insights

  • Assisted in creating a survey to validate findings

  • Collaborated in workshops to map out a hypothetical customer journey

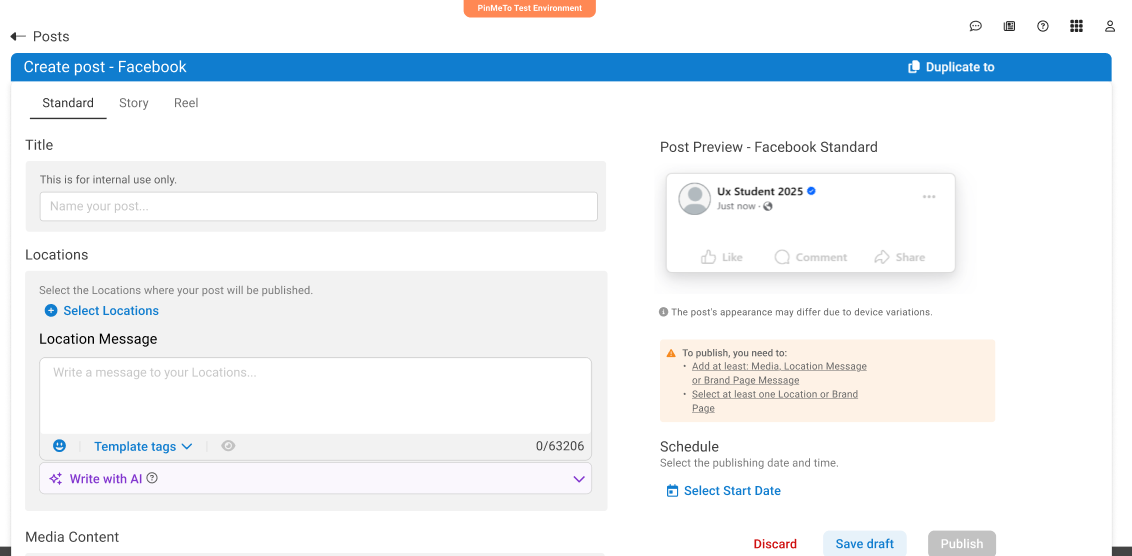
  • Contributed to the development of a digital prototype in Adobe XD

  • Conducted usability testing with the prototype

  • Made several user flows of use cases based on the prototype

  • Participated in design sprints to generate potential concepts

  • Conducted market research to investigate and analyze existing solutions.


The interviews regarding reuse and recycling

Before I joined the project, some conducted interviews regarding reuse and recycling had already been conducted which generated a few hypotheses worthy of further investigation.

Based on these hypotheses, I worked with the team to create a set of interview questions to dive deeper into these tracks and to get a sense of what sustainability means to people. I also made sure to add follow-up questions to further understand their thought process.

Here are some examples of the interview questions:

  • What are your thoughts on consuming products responsibly and sustainably?

  • In terms of sustainable consumption, where do you see yourself on a scale of 1-10?

  • What would you say is “your way” of being a responsible consumer?

  • Do you have enough information about the impact of your consumption on sustainability?

  • What kind of information would change your consumption behavior?

  • What role do your family, friends, and social networks play in influencing your behavior?

  • What would encourage you to be a sustainable and responsible consumer?

We conducted five customer interviews over a two-week period. I transcribed the recorded interviews to facilitate our data analysis process and to ensure that we did not exclude any important information.

Based on the data collected, we found that:

  • Family and friends have a greater influence than celebrities and politicians. People are more likely to listen to those they can relate to.

  • Participants want transparent information from companies and brands about their sustainability efforts and what terms like "cruelty-free" and "ecological" mean. They want to be informed about the impact of their sustainable choices.

  • Most participants believe that companies and the government have a greater responsibility for sustainability than individuals.

  • Participants want to be rewarded for their sustainable efforts, whether through a sense of accomplishment or monetary rewards.

  • Participants want educational and informative information about their sustainable blind spots, rather than being blamed for their lack of knowledge.

Overall, the key findings from these interviews highlight the importance of providing clear, transparent information and creating a sense of personal reward for sustainable choices, while also avoiding blame or guilt.


Secondary research

After conducting user interviews, it was a valuable decision to also conduct secondary research in order to gain a deeper understanding of human behavior and how it relates to reusing and recycling. I conducted research on the topics of nudging and social norms and consolidated the findings for my team.

These are some of the findings from the research:

  • Nudging provides two benefits: guidance in difficult decision-making processes, and the ability to opt out of those situations that conflict with an individual’s wishes or benefits.

  • Social norms have a major impact on behavior since people are social beings.

  • One of the biggest weaknesses is that nudging is difficult to use to form policies that both work in an artificial environment and have the desired effect on the entire population.

  • There are two ways of social norms impact behavior: prescribed norms and descriptive norms. The prescribed norms indicate for the individual a moral implication, ie. what should be done and what should not be done. And descriptive norms refer to the simple observation of how all or most others are behaving. 


The Recycling Experiment

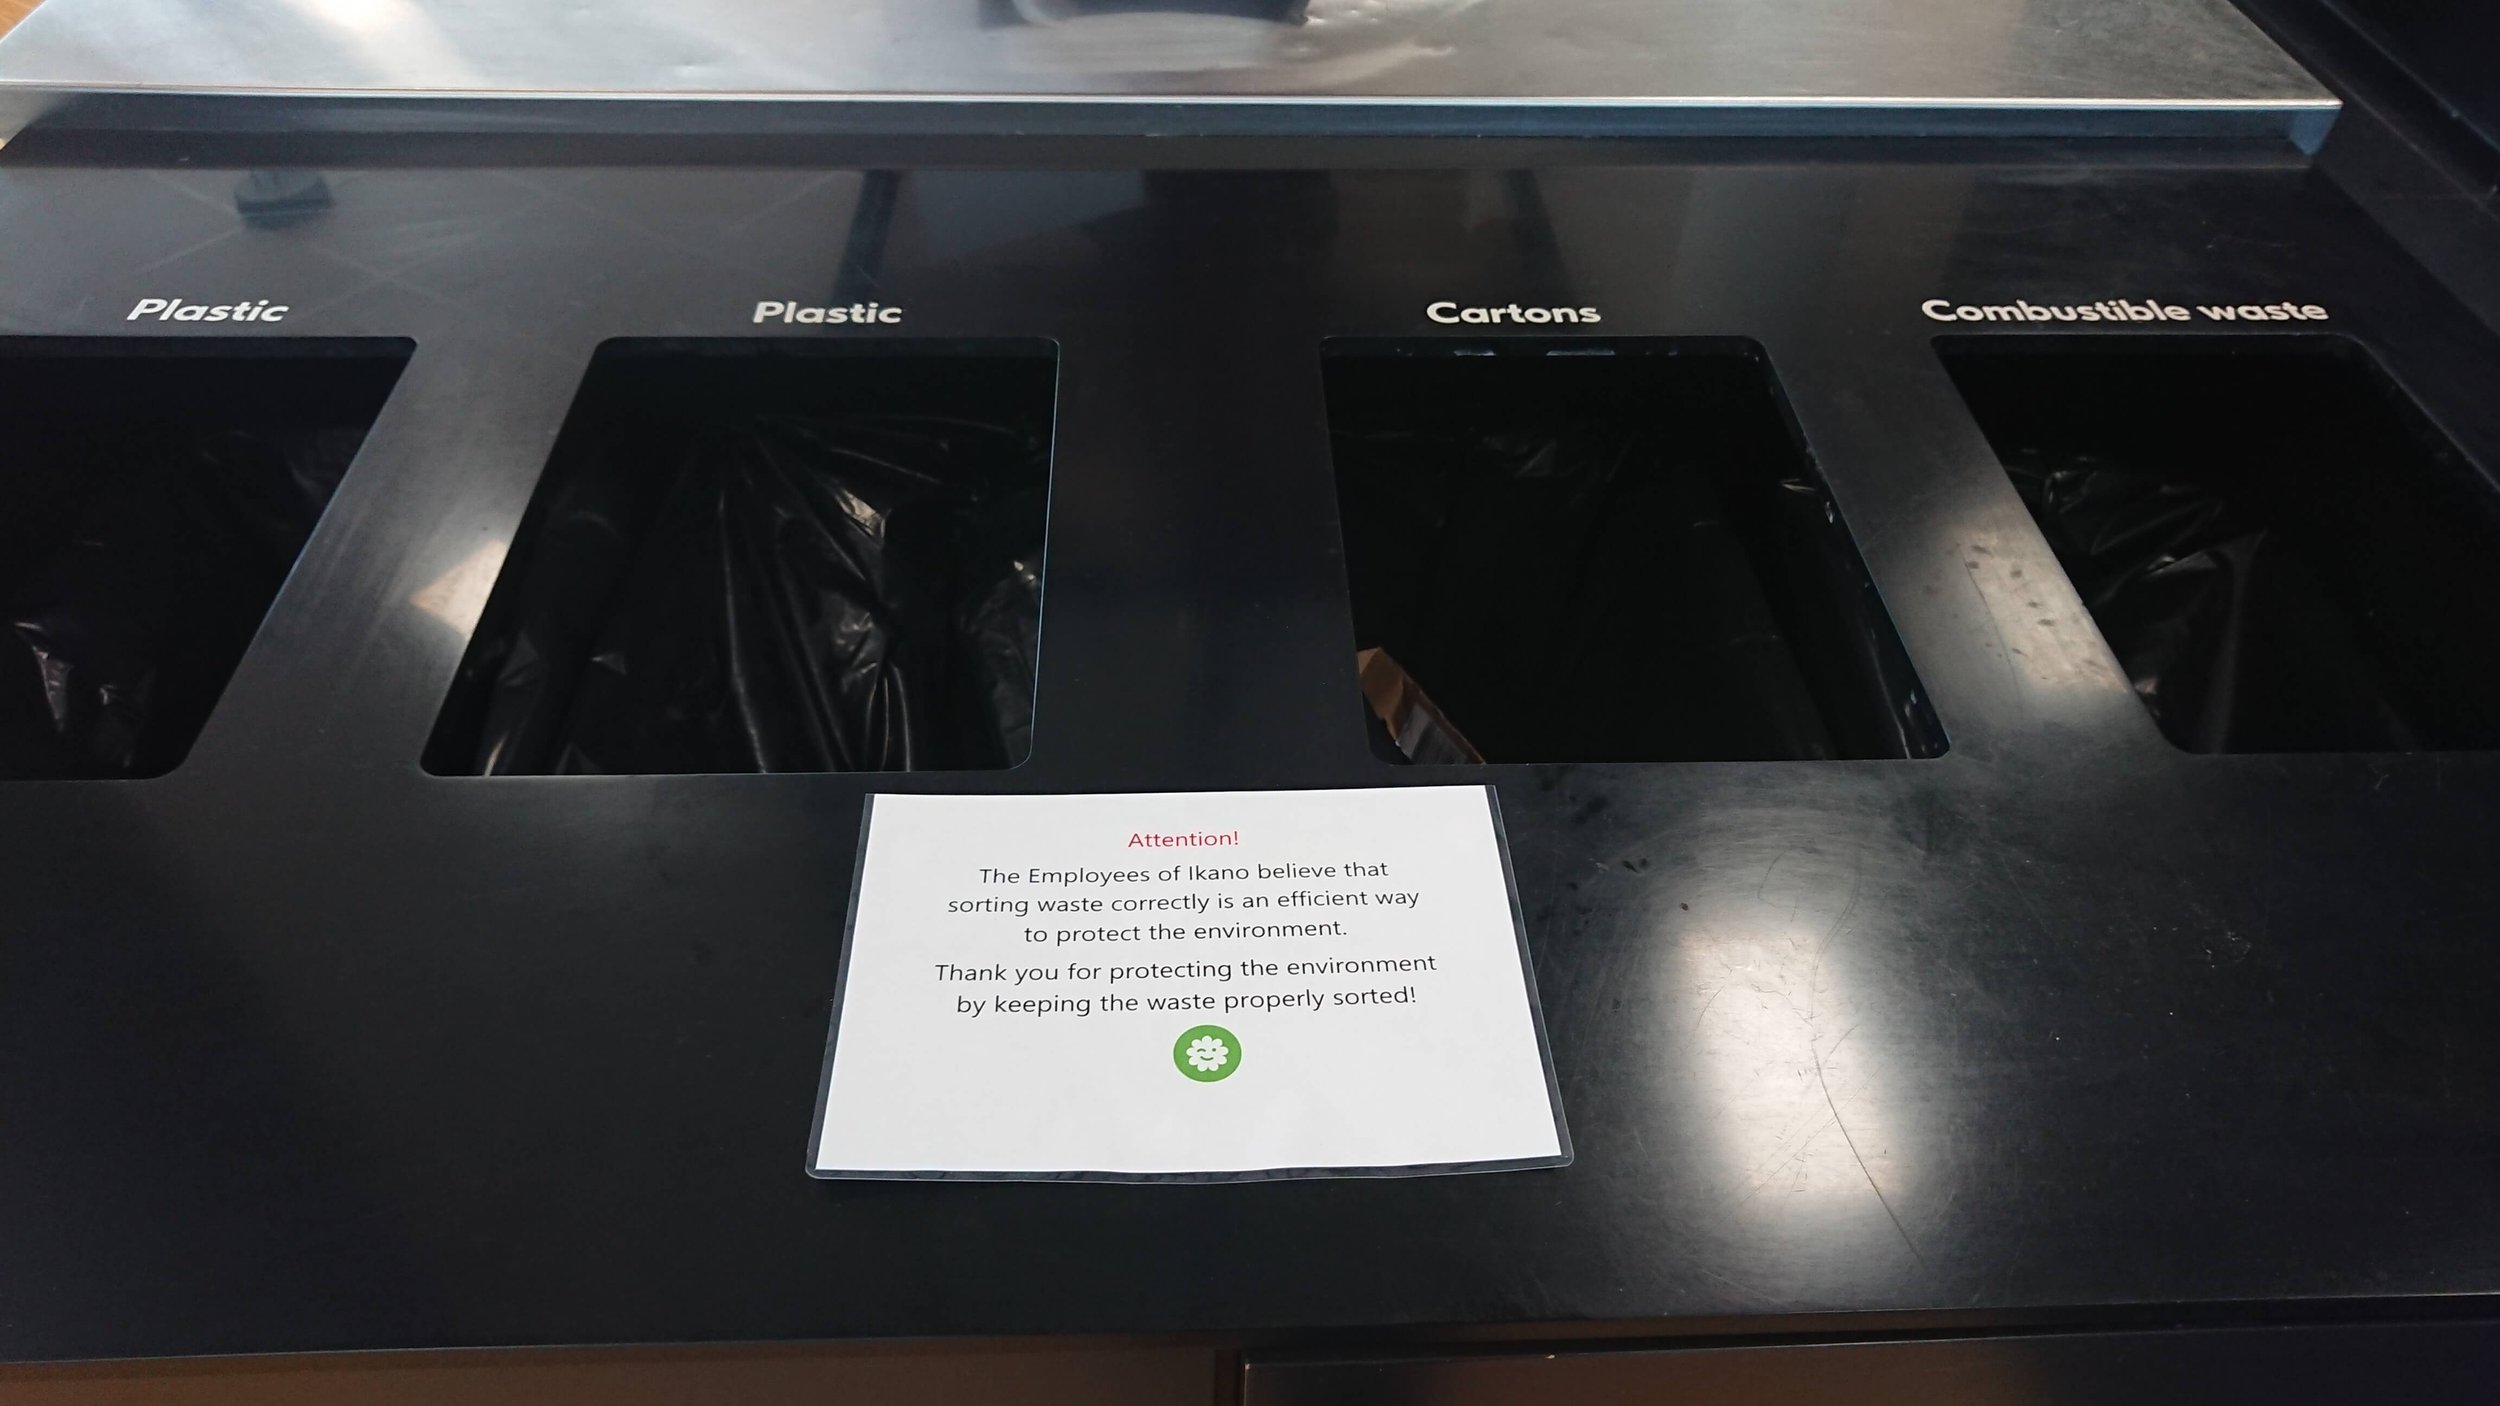
I was inspired by the research on social norms and nudging in human psychology and wanted to test their impact on behavior in a real-world setting. As such, I conducted a quick internal experiment within Ikano Bank, focusing on the waste sorting in the eating area. I observed that the waste was not being sorted properly, and decided to place notes with social norms messages in the area to encourage employees to sort their waste correctly (figures 1 and 2) I took pictures of the waste sorting area before and after work hours across five workdays to see if there were any changes in behavior as a result of the notes.

However, there were several limitations to this experiment. The environment was not completely controlled, and I was unable to observe employee reactions or conduct follow-up interviews to understand their reasoning. Additionally, analyzing the results solely based on pictures of the waste sorting area may not provide enough information for a deeper analysis. To fully understand the impact of social norms and nudging on behavior, it would have been necessary to conduct more in-depth research with consistent observations and follow-up interviews. Despite these limitations, I found the experiment to be an interesting and valuable learning experience.


Figure 1. One of the notes was placed on the food waste sorting at Ikano Bank.


Figure 2. The other note was placed on the plastic, cartons, and combustible waste sorting at Ikano Bank.


Competitive analysis

I analyzed the business models of nine Furniture as a Service (FaaS) competitors worldwide to gain insights into the industry (figure 3 and 4). I created a digital comparison table to easily evaluate their features, subscriptions, costs, etc.

Through this research, I discovered key insights such as:

  • Customers won’t pay more than the furniture's total value, it’s a payment spread across time. No interest rate (It’s yours as long as you need it) 

  • Some customers use the service as a trial period before committing to purchasing the furniture.

  • The delivery and assembly are free, there are no extra costs 

  • Some services have a minimum monthly cost that must be achieved (usually 99$), which makes singular furniture investments under 99$ not feasible. More aimed at moving scenarios that trigger several furniture investments? 

  • Many companies offer options to opt out of the subscription, such as buying out or returning the furniture.

  • Offer move furniture to another location services (from free of cost to 98$)


Figure 3. An example of a competitor’s FaaS offering


Figure 4. The table that I created to analyze and compare the 9 different competitors.


Customer interviews regarding FaaS 

After some meetings and discussions, we identified two scenarios where FaaS could be a relevant offer: when people move or when people need to update a room. We decided to conduct customer interviews regarding these scenarios and FaaS. We wanted the information from these interviews to help us understand the customers’ experiences, problems, and emotions throughout their journey of moving and updating the furniture. 

We conducted 11 interviews through 3 iterations.  We had a range of participants from different age groups between the age of 18 and 60. The interviews were divided into two subsections corresponding to each of the two scenarios. It helped us focus on one scenario at the time of each interview and not both scenarios at once. I assisted in the recruitment of participants by contacting the participants and scheduling the interviews. During this time, one of my supervisors had to take a sick leave. The situation gave me more responsibility in managing the recruitment process and interviews.

With the interviews, we also wanted to understand the four factors that people consider when buying furniture (style, convenience, affordability, utility) and how people define these factors. We were also interested in their views regarding ownership of furniture and subscriptions overall.

These were some of the interview questions:

  • What are your expectations for the moving process?

  • Are you making any renovations to the new home? 

  • What kind of factors do you consider when buying furniture? (Style, affordability, utility, convenience, environment,  etc.)

  • If you would want to save the environment which factor would you sacrifice? Why? (convenience, affordability, style, utility)

  • What do you care about style (fashion, personalization, uniqueness)

  • Are there any risks that you fear? Financial, social or technical risks?

  • What is your opinion on accessibility instead of ownership with furniture?

  • What are the frustrations of owning furniture? 

I analyzed the interviews by creating a digital table similar to the affinity diagram method (figure 5). I added the names of the interviewees at the top of the table and I placed each data below the respective name. Afterward, the repeating data were divided into colored categories which I created at the left of the table. Using this method, helped me find repeating findings and put them into categories, thus I could have a nice overview of all the data.

Here are the key insights from the FaaS interviews. 

  • The overall pattern is that they don’t change furniture often, averaging over 5- 10 years. 

  • Most of the customers didn’t mind second-hand furniture excluding bed furniture. And they buy or sell second-hand furniture to people they know rather than from people they are not familiar with

  • The majority of the interviewees prioritized style as it should reflect their own taste and personal style, no matter if it was trendy or not. 

  • The biggest pain: is getting rid of the old furniture when they have bought new furniture. (time-consuming) 

  • Customers don’t buy furniture often, the major investments in furniture occur when they move. Investments can also occur in renovations. 

  • They don’t see subscriptions as ownership especially not with furniture. They don’t want to worry about extra fees or damaging the furniture.

  • All use some kind of system like recycling garbage and bottles, clothes, etc. 

  • Currently, there does not exist a good system that facilitates the transaction of old furniture smoothly.


Figure 5. I created a table based on the affinity diagram method to analyze the interviews.


Survey

After conducting customer interviews, I assisted in creating a survey to further validate the insights gathered during the research. The survey consisted of 10 questions and had 55 participants. It helped us prioritize our insights and understand their behavior related to their furniture.

The results of the survey were as follows:

  • 50.9% of participants typically sell their old furniture on second-hand marketplaces (figure 7)

  • 63.6% of participants want their old furniture to be useful to others (figure 8)

  • 96.4% of participants can imagine paying for a service that picks up and disposes of their old furniture in certain scenarios, such as when the furniture is too large to transport or remove on their own (figure 9)

These results formed the foundation for our "How Might We" (HMW) questions, which framed the design challenge that we believed our customers wanted to solve. I was also involved in a design sprint, where we came up with a concept and created a digital prototype.

Figure 6. 50,9% of the surveyees sold their old furniture at second-hand markets.


Figure 7. 63,6% of the surveyees wants their old furniture to be useful somewhere else.


Figure 8. 96,4% of the surveyees can imagine paying for a service that picks up and takes care of the old furniture based on different scenarios.


The Deliverables

The outcome of the project was a service concept, accompanied by a digital prototype. I assisted in creating user flows for six different use cases, which visually demonstrated how we envision customers using the service. These user flows were an effective tool for communicating the concept's utility to stakeholders. Additionally, the prototype was used in four usability tests with customers to gather feedback on the design and concept.


Learning takeaways

  • I gained experience in conducting user research through interviews, surveys, and usability testing.

  • I learned how to analyze and synthesize data through methods such as affinity diagrams and user flows.

  • I had the opportunity to work with a cross-functional team and learned how to effectively communicate and collaborate with team members from different backgrounds and roles.

  • I also gained experience in creating digital prototypes and presenting them to stakeholders for feedback.

    Overall, this project allowed me to apply and enhance my skills in UX research and design in a real-world setting, and it was a valuable learning experience for me.